


The Precipitation Problem in Agriculture

Precipitation is arguably the most important agricultural weather parameter, yet it is the most difficult variable to precisely measure. For a wide variety of agronomic decisions, accurate tracking of actual rainfall during the course of a season can be very important. Fortunately, our ability to provide useful precipitation forecasts beyond the next few hours is not highly dependent on our ability to measure what has actually happened.
When you think about the simplicity of a typical rain gauge, you might think it should be the most widely and consistently reported weather variable. However, if you read my article from last month about estimating field weather and soil conditions, you might recall the reference to an American Meteorological Society essay that showed all of the known operational rain gauges in the world could fit on half a football field. Within that set of gauges, there is a mix of manual and automated gauges of varying types with little standardization of reporting frequency and accumulation length. For the ones installed in areas where frozen precipitation occurs, there is a whole plethora of issues to deal with if the gauge is not heated or designed for those conditions (hint: the majority aren’t). There is almost no other dataset in meteorology more frustrating to work with than precipitation reports.
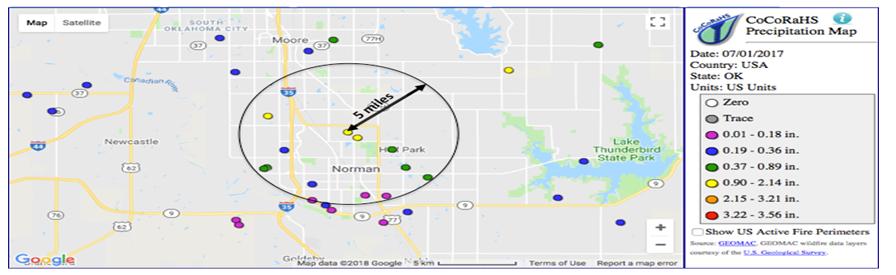
Making matters worse, precipitation is probably one of the most spatially variable meteorological parameters, with large differences often occurring across small distances, especially across regions like the central U.S. where a majority of the seasonal rainfall comes from spring and summer shower and thunderstorm activity. The Colorado Collaborative Rain, Hail and Snow (CoCoRaHS) network was formed as a means to increase the density of precipitation reports through public engagement in order to study things like spatial variability of rainfall. The CoCoRaHS map above shows all of the daily reports in my home county for the 24-hour period ending at 7:00 AM CDT on 1 July 2017. It is a good example of how variable rainfall can be. My rain gauge is at the center of the 5-mile radius circle on the map, and it measured 1.17 inches. Within that radius, reports ranged from 0.12 to 1.37 inches. There are a lot of meteorologists and weather enthusiasts that live in my city, and so the number of reports shown here is very dense compared to most of the U.S. If only one of these reports was the nearest to your farm and you were 10 or 20 miles away, which one would be most representative?
MORE BY BRENT SHAW
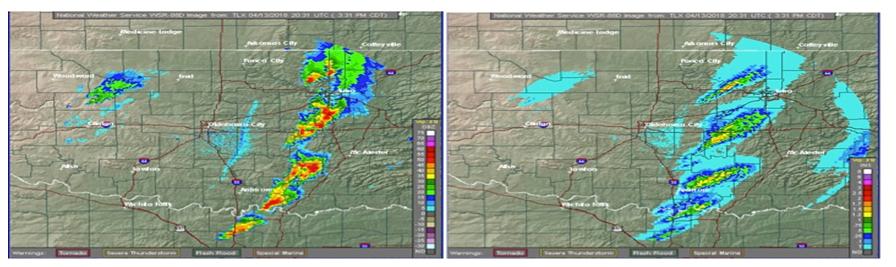
Fortunately, in the U.S. we have a very good weather radar network we can use to fill the gaps. The National Weather Service (NWS) radars are able to provide instantaneous estimates of precipitation rate every 2 to 5 minutes (depending on the operating mode) on grid cells that are less than 0.5 miles on a side. These instantaneous measurements of returned power can be converted to precipitation rate, and then the rate values can be summed over time to provide estimates of accumulation. The images below show an example of instantaneous intensity (left) and derived precipitation accumulation for the past hour ending at the same time.


However, while radar provides great temporal and spatial coverage where available, it has its own set of challenges. First, the algorithms used to convert what is measured (returned electromagnetic power compared to what was transmitted) into what we want (precipitation rate) have numerous assumptions that introduce error, the magnitude of which varies greatly depending on the weather situation and distance from the radar. Some common sources of error include:
- False echoes: Buildings, trees, wind farms, birds, bugs, and other objects can produce false echoes that in many cases are difficult to automatically identify. If they get through, large over-estimates can occur at those locations. If removed, underestimates can occur at those same locations when they are within an area of active precipitation.
- Beam blockage: Buildings and objects near the radar can lead to underestimates along the same radial.
- Beam spreading: The radar beam itself “spreads” with distance, leading to a larger area being sampled with each successive pixel.
- Attenuation: When multiple storms intersect the same radar beam, the more distant storms can appear weaker than reality due to the signal being weakened by the storms that are nearer the radar.
- Beam height: The lowest available beam is about two miles above the ground by the time you get to 100 miles away from the radar. That means the beam is “seeing” things very high in the atmosphere. If looking into elevated core of a thunderstorm or the melting layer (the altitude where ice aloft is melting into liquid) a large overestimate could occur. Alternatively, if there is shallow precipitation occurring in the low levels of the atmosphere, the radar may miss it altogether.
- Fast moving storms: Because the radar provides only instantaneous snapshots, things that happen in between the images go undetected. In the example image above, the 1-hour accumulation field on the rate shows some “scalloping” effects due to this.
- Availability and coverage: While the U.S. has a very dense network, there are still areas left outside the range of coverage. And, across the rest of the globe, radar data is largely unavailable for a variety of reasons. Many countries don’t even have radar, and those that do may only have them near airports or major cities and may be unable or unwilling to share them in digital format for deriving precipitation.
There are also satellites that can provide precipitation estimates, but those tend to be even less accurate than radar, especially since the best precipitation detecting satellites tend to be in low-earth orbit and only pass over a location a few times a day, meaning there are potentially large gaps in temporal coverage. I won’t go into all of the potential errors in satellite-based detection in this article, but suffice it to say there are many.
In a perfect world, we would have accurate, automated, IoT-enabled, all-season rain gauges deployed every few miles around the world. While technology is making this more feasible with each passing year, there are many challenges that remain. In the meantime, in lieu of the perfect network or even having sensors on every farm field, the best precipitation estimates combine all the available sources, along with estimates from numerical weather analysis and prediction models. These “multi-sensor” techniques are the gold standard for providing the most accurate, geographically and temporally consistent results to power agronomic decision aids. And while they are not perfect, they can provide a much better estimate at a remote location than using a rain gauge that is more than a few miles away from the location. And, while they are often reported to the nearest 0.01 inch as if they are a virtual rain gauge, we should set realistic expectations that such precision is really not feasible. Even a highly accurate gauge that is capable of measuring with this precision is only measuring at a single point in a field, and there may be variations in rainfall that exceed several hundredths of an inch or more, depending on the situation.
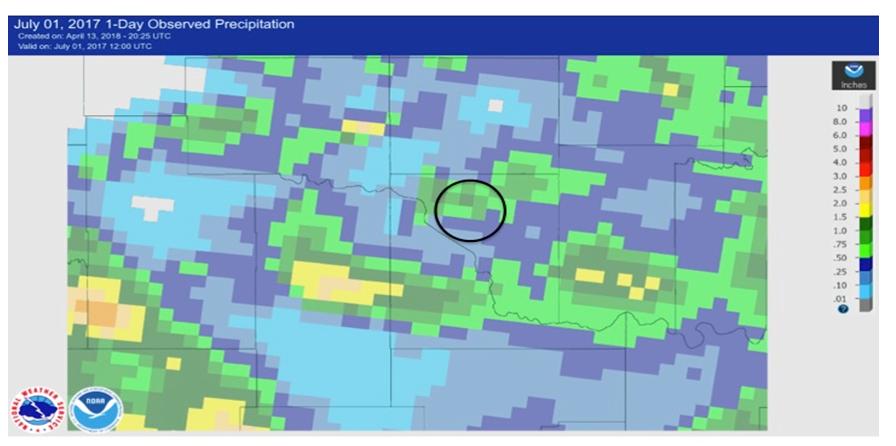
One publicly available example of a multi-sensor precipitation analysis is produced by the NWS Advanced Hydrological Prediction Service’s (AHPS) on a 4-km grid covering the U.S. The image from the AHPS analysis for the same 1 July 2017 case shown earlier is included above, with the same 5-mile circle shown for reference. Note that the color scale is different from the CoCoRaHS observation plots, but there is one grid cell roughly corresponding to the same area as my station that estimates the rainfall to be between 1 and 1.5 inches. Given that my observation would not have been available to this analysis, this is a credible result and representative of the state of the meteorological science in the U.S.
So, the next time you are comparing the precipitation estimate found in your digital farming app of choice to what you measured in your own gauge, keep all of this information in mind. In general, virtual gauge estimates are going to be good enough for operational decision-making and can save you time and money by helping you prioritize geographically separated fields for irrigation or other operations that are sensitive to rainfall, even when they don’t exactly match a “nearby” gauge. If you are seeing extreme, consistent errors, you may want to discuss with the app provider and ensure their source of meteorological information is employing spatially-relevant, multi-sensor techniques. Even if they are, it may be that there is a yet undetected source of error in your area, whether it is an erroneous nearby gauge or one of the many situations identified above that can affect the radar-based estimates. In these cases, the provider would probably appreciate the feedback, as it helps them identify new issues and develop mitigating quality control techniques.
Subscribe Today For