Harvest: Influencing the Season ‘Report Card’
Harvest is always an exciting time of the year, to reap the workings of an entire growing season and begin evaluating decisions to make for the coming season and year. Knowing how trials, varieties/hybrids, and management practices impacted final yield at harvest is critical to understanding what the best decision is to make for the next year, and continually improve on finding profitability.
When it comes to harvest time, yield coming in is similar to a report card we all got in school growing up. At the end of the year, the report card was “fixed” and there wasn’t anything we could do about it or change, albeit extra credit! In agriculture, we don’t often get extra credit, but we do have opportunities throughout the year to influence our report card, especially using digital agriculture to make quick decisions during our planning, in-season decision making, and analysis after harvest to get those “C-” reports up to “A+” reports before finding out at harvest when it is too late to influence that report. Just as we used report cards to decide what classes we were good at, and maybe not so good at, to find our future life paths, a complete yield map can be used to help guide decisions for coming seasons and give insight that previously was unknown.
Pre-Season Planning
Yield data is a great way of validating what happened throughout the season, and how the decisions we made in years past will pay off for us in the future. Although the environment will dictate many of our final reports, using yield data for pre-season planning can be impactful to identify opportunities in input decisions, zone management, and marketing the crop. We should always remember that the report card is just a map of what happened in that year, and potential in the field could be different than what the performance was on that yield map itself, as we learn more about the opportunities in the field. Areas that perform poorly may just be an area of low fertility, and getting a full picture of the “Why?” behind those areas helps greatly in planning. Understanding hybrid differences across soil types, irrigation practices, and fertility timing/placement can all be ways of using data at harvest to make efficient decisions at the beginning of the year.
In-Season Decisions
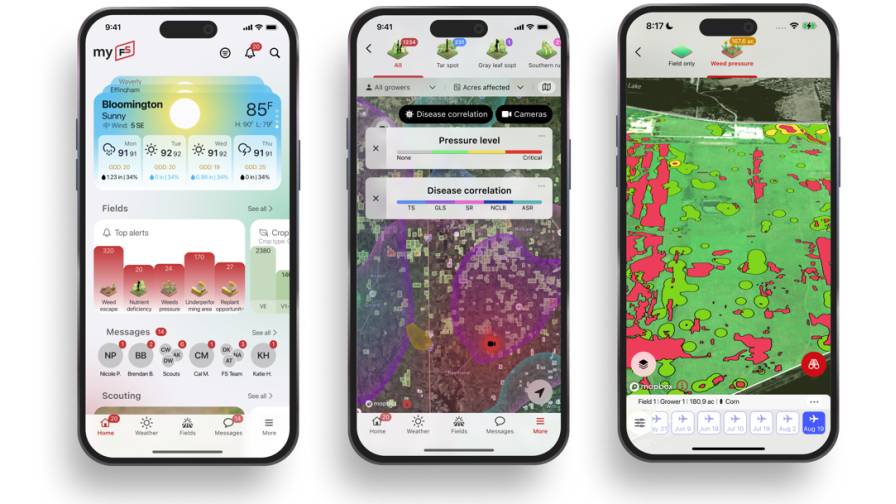
Yield and harvest data can also be used to make in-season decisions, when paired with digital tools giving insight across a farm. Understanding variability in the field from one season to the next can help determine whether or not to make that next fungicide pass, or put that extra fertility on or not. Exciting waves are being made in yield prediction, and predictive analytics help provide information on what decisions to make and when before yield is impacted by a potential pest or environmental condition. Areas where variability shows higher than previous years can influence decision making in-season by deciding new ways of management and opportunities to influence that report card before we get the final grade at harvest.
MORE BY SCOTT SPECK
Post-Harvest Analysis
Post-harvest analysis is one of the most exciting things that is continually evolving in the digital agriculture space. As more farms become connected to technology, data collection, analysis, and even aggregation for benchmarking are making it easier to identify opportunities for coming years without filling an entire farm with every hybrid/variety and trial possible. Analysis lets us know how our decisions made during the planning and in-season parts of the year performed, and give a look into how to capture opportunity with data for next year.
How did planting a week later due to weather impact yields? Did those yields vary based on soil type or fertility? What did that fungicide pass return? Was it really that “bad hybrid” or was it over watered in the bottoms? Those questions can easily be answered with complete data at the end of the season, to reduce the guesswork out of making decisions for next year. Benchmarking systems anonymously now give aggregated data in local areas to decipher potential for input decisions and management practices that perform locally, but haven’t been tried yet on a single farm.
As we approach the end of harvest in many areas, and continue through the rest in other areas, the questions of “What to do with the data?” come down to understanding how to capture opportunity. Raw yield data is only as good as the calibration, which can never be constant throughout the day with changes and erroneous points coming from speeds, moisture, and swath widths, starts and stops, multiple machines, and different crops.
Using processed data to get a clear “report card” enables a producer to use a validated layer that ensures the yield is displayed in the right amount, the right places, and is correct for record keeping. Processed data removing those points and using true weights off the field is critical for marketing, fertilizer replacement, insurance and records, and building zones with yield influence. Whatever you use yield data for, a processed layer is key to remove those points that can give a false report, and give the clearest picture for the process to start again next season. Enjoy the rest of the 2018 season, and have a safe finish to harvest!


