


Putting Agronomic Advice Into Action – A Full-Season Field Trial

Contributing writer Jacob Maurer was granted the opportunity to be a decision-maker as part of a collaborative team in charge of a 90-acre research farm in North Dakota’s southern Red River Valley.
It’s one thing to read, write, or know about helping customers best manage their fields – it’s another to put it into action, to go into the field and do it ourselves.
Understanding and making data actionable and best use of the John Deere Operations Center are two topics I’ve recently discussed. Earlier this year, I was granted the opportunity to be a decision-maker as part of a collaborative team in charge of a 90-acre research farm in North Dakota’s southern Red River Valley. I felt this to be the perfect chance to now show how I, as an agronomist and farm manager, took my own advice and actually used those strategies in the field.
Setting the Stage
This research farm, or land lab as we call it, is a three-year project. At the start, I was given an FSA map of the ground, a SSURGO soil map, and a set of zone soil samples that had been collected the previous year.
This relatively small amount of information made me realize my best strategy for really getting to know this farm was to take my own advice and break it down into smaller pieces – namely by agronomic event. In the past, the parcel had been farmed as a whole; I chose to split it into two pieces. This was for several reasons, the biggest was to generate two complete datasets per year instead of one.
MORE BY JACOB MAURER

The land had been planted with soybeans for the past four seasons. There was interest in seeing a full season of crop and equipment data from something new so, because we had the flexibility to change what was planted, it was decided to do half corn and half wheat.
I threw away the previously-created zones, and decided to farm both fields with a broadcast approach to see if they would eventually break themselves into the same zones based upon my own research. Time will tell if this was the right approach, as the team begins coupling yield data, imagery, and other metadata across multiple years.
Which brings me to a key point: This is a three-year-long research project, so a lot of learnings won’t come until year two or even three. However, now that I have nearly one full season under my belt on this farm, here’s how the team and I applied my best practices throughout this first crop cycle.
Tillage
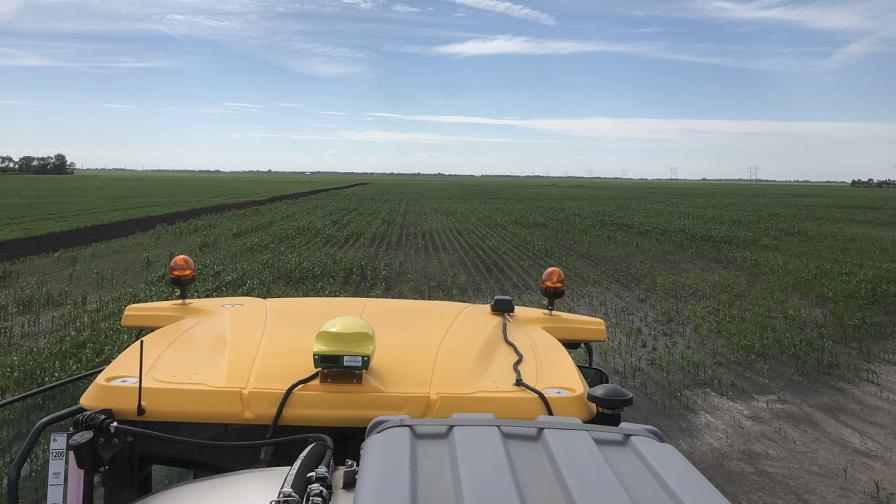
Because tillage was the very first data layer collected on the land lab, I honestly didn’t know what to expect. We used a John Deere 9RX tractor with a Gen4 Command Center paired with a 2230FH field cultivator with TruSet.
I was impressed that I was able to visualize, not just the heading and a simple log of down/up, but that our dataset actually recorded shank depth and pressure from our rolling baskets. I almost think of this as a “bonus” dataset, as I was not anticipating the ability to collect and save the actual manipulations being made by the system.
This first year, conventional tillage was used on both sections. Next year, plans are to do half conventional and half no-till. This will be when the real fun and learnings come, as we’ll have the opportunity to compare the two datasets. I predict we’ll be able to build some quality tillage prescriptions with the info and I’m excited for that process.
Planting/Seeding
For corn planting, we used a DB planter with ExactEmerge row units and collected data via the Connect Mobile app. Also part of the equation was an 8R tractor with a Gen4 Command Center. To test out the capabilities of our planter, we did a speed test (going from 4 to 12 miles per hour). This would allow us to document mechanical impact we would have on the field, yet hopefully not cause any negative agronomic impact.
What we found was there were limited differences as we increased in speed, but that the planter definitely had a “sweet spot” when it came to singulation, as it performed increasingly better up to a certain speed and then it tapered off. Agronomically speaking, the stand was not affected in terms of emergence or quality. The primary differences showed up in spacing, when we measured it with a tape, but not in our imagery.
As I write this, we haven’t finished up corn harvest so if there is not a significant drop off in yield, the ability to increase speed could prove to be an incredible benefit, especially in cases where work needs to move fast ahead of a weather event.
The wheat was seeded with a CCS drill paired with a tractor with a 2630 display. This combo gave us the ability to document a similar application as our planter, but with the ability to visualize the differences in data collected by the displays. In the John Deere Operations Center, the differences are largely noted in Field Analyzer Beta, as we had a few more layers to work with, which included elevation and quality (a calculated difference between target and as-applied seeding rate).
Because we used different equipment in each section, we weren’t able to compare data this year, however, with next year’s plan to plant corn and soybeans, we’ll use the same equipment on both and gain additional learnings from having comparable datasets.
Spraying
A key benefit of data collection and analysis is the ability to quickly adjust operations, if needed, to address potential issues. That was true during tillage and planting. However, when it came to herbicides and fertilizers, those application data layers were intended for record-keeping in year one. The data was used in-season for validation, but we knew its true value would become more apparent in year two.
In terms of record-keeping, the data layer collected with the 2630 display in a Hagie STS12 self-propelled sprayer indeed helped that process, as products and rates were easy to document. It was especially valuable when producing the final spray records.
Because we had two separate crops, we had two different product mixes to contend with. The system did a great job distinguishing between both spray jobs and documenting both tank mixes.
Harvest
The wheat harvest data layer was probably the least anticipated but perhaps the most impressive of all data layers. The combine used was a new John Deere S780, featuring CombineAdvisor, ActiveYield, and Gen4 Yield Data.
Thanks to the enhanced definition of mapping and the increased number of data collection points of the new Gen4 system, it was the largest of all the layers from this growing season – and corn still has yet to be harvested.
Because the entire team wasn’t present at harvest, we used the My Operations app to follow the combines’ activity, with the data stream uploaded in real-time. This proved to be a great way to keep the team connected and aware of harvest progress, even when all couldn’t be there for the process.
Crop Scouting
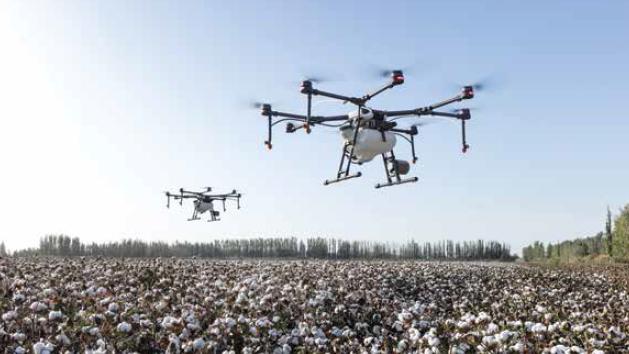
In addition to equipment on the ground, a fixed-wing UAV was used to collect data in the format of imagery. Typically UAVs are used to identify areas of crop stress, pests, or other issues to address in-season, however, the UAV was used as a documentation and benchmarking tool.
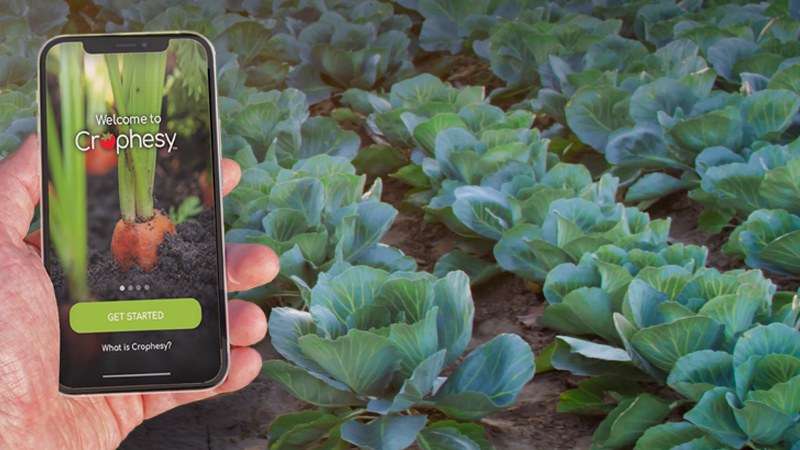
After processing the first set of images, I decided to collect a dataset once a month (or after a critical event) as a means of documenting crop progress. Using an API with Sentera FieldAgent, I was able to transfer all collected images to the John Deere Operations Center. By doing so, I could use the My Operations app to go out and ground-truth the data.
The digital crop scouting was a big hit with the RDO Equipment Co. team, as it offered the ability to pair screenshots of my phone in the app with pictures I took on the ground, and share with them in real-time. Next season, I will explore some of the additional digital crop scouting offerings that my colleague, Nate Dorsey wrote about previously.
Learning More Than Expected
My biggest takeaway from year one working in the land lab was not necessarily what I learned from the data as much as what I learned about how I can act on data that supports my ideas. A big eye-opener was that an “actionable” decision doesn’t necessarily mean that an action must be taken; making a decision to do nothing is an option. To re-adjust my theory and offer advice for all of us who help customers analyze data, “actionable” can also mean validating a decision of not doing something.
Along those lines, I realized data doesn’t have to require an immediate action for it to hold value. While I taste a bit of crow on my tongue from previous comments, I’m learning that there are times the data collected today needs to be supported by multiple observations to come from the future in order for it to lead to an action, or to truly realize its worth. With at least two more years of work ahead in the land lab, I look forward to putting this new practice into action.
Subscribe Today For