


How Brazilian Farmers Are Realizing the Potential of Satellite Imagery

The use of satellite imagery in Brazilian agriculture has evolved over the past decade. At first, it was commonly used in southern and southeastern Brazil. But in the last 3 years many agtech companies have made it more available to consultants and producers to use throughout Brazil, which has also coincided with an increase in the quality of this technology.
In particular, I have observed the growth in satellite imagery use by producers in the Brazilian Cerrado, the center and west region of the country, where we have some of the largest soybean growers. I always say that from the beginning of the harvest, it is essential that these producers are guided to monitor their production areas, identifying problems in advance and making decisions at the right time, thus obtaining better results.
In 2020, I started using the Granular Insights service, which is already widespread in the U.S. Some of my customers have started to understand the potential of this technology to achieve better yields.
I really enjoy using the example below to illustrate this point to my grower customers. When we follow the soybean culture as the plant grows, we can notice a high vegetation index. In this phase, which extends from V1 to V5, the producer must constantly monitor his fields, where, in this example, it is possible to identify the presence of weeds on the soybean.
MORE BY MAURICIO NICOCELLI NETTO
How a Digital Platform Is Creating Transparency with Brazilian Harvest Data and Bringing Security to Investors
Brazilian Agtech Startup Brings Aerial Application Management Platform to North American Market
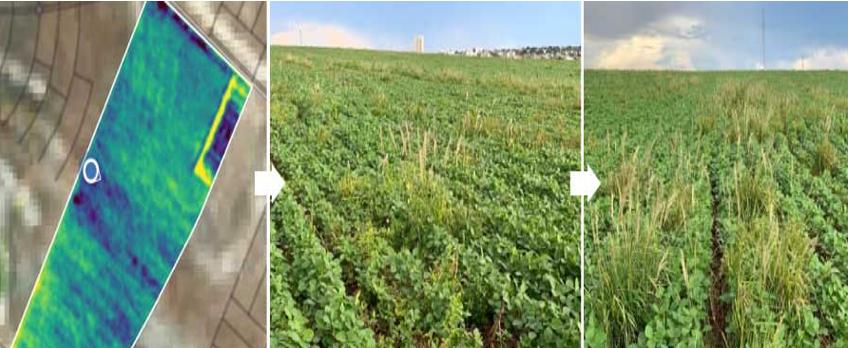

In the image above we saw the weed (Eleusine indica) between the lines of the soybean crop, this helps the producer to find variability, which sometimes he wouldn’t be able to see until it is too late.
Management Zones Creation
The use of management zones aims to indicate the management strategy according to each need of your plots. In order to achieve great results and establish a good management area, it is necessary to know more about the crops grown on the site, the climate, and the soil.
For better crop performance, it is recommended that the producer individually work each area of his plots according to their characteristics, be they chemical and physical properties and the texture of the soil.
To create a management zone using satellite images, we can use different platforms such as Granular Insights to download the Vegetation Index layer of the field in Shapefile format and use it in the preferred GIS software, such as AgStudio, SST, and AgLeader’s SMS, for identifying management zones.
What We Can Evaluate in the Corn Crop
The vegetative index needs to be consistent with the cropping period. If, at the beginning of the vegetation, the index is high, the producer will probably be able to identify some problems, such as:
- Presence of weeds.
- Performance of pre-emergent and post-emergent herbicides (herbicides applied before and after planting corn), which should have eliminated any remnants of vegetation.
Now, if the crop is already developing and, in a given location, the algorithm points to lower vegetative indexes than the rest of the plot, the producer will be able to evaluate and identify:
- Failures in the planting process (some area where planting was not uniform).
- Quality of seed treatment (assess whether the seeds planted are being responsive to the desired factors).
During the reproductive period of the corn crop, which goes from VT to R6, the vegetation index can help in the identification of:
- Spots of nematodes, parasites that cause diseases in the plant.
- Compacted areas, because in areas where the soil is compacted, the roots do not fully develop.
In Summary
In Brazil, we always need to be searching for the best tools to improve our yield potential. And satellite imagery is just one example of the latest agtech tools that are helping Brazilian growers facilitate decision making, and in the process, helping the evolution of agriculture.
Subscribe Today For