


Digital Farming: Keep It Simple Analytics

In previous articles, I tried to lay out some logical components and processes that enable digital farming to get inside of the decision loop and provide decision quality outcomes. It is no surprise that digital farming is taking a long time to really get going. At its core, and a major part of its inception, is analytics, and this is complex. We can simplify it by taking it sequentially one step at a time.
While I am not an agronomist, nor do I have years in the field, I must take a moment and reflect upon a given. Whatever is done must be understandable in a simple and straight forward approach. This means analytics is production ready. The user should not have to manage or manipulate the data. With this understanding the given should be: “What must be done and can be done almost immediately to start? “To start” means to support decisions with simple analytics and sequentially build upon these results.
To keep it simple, and to start the process, is about understanding the decision loop, the needs required at that point in time, and collecting and analyzing the data to support the needed outcome. It is about aligning analytics with the power of the digital platform. It is about using this platform to establish the value of the digital farming concept by automating and integrating the required analytics so that each decision is aligned and enables the delivery of quality information.
In my previous article, I proposed an organized way to approach the decision process using a modified OODA loop. I aligned imagery with this decision process. There is an equally important component of this alignment and that is the straight forward approach to aligning the analytics. Analytics is what supports the strategic context and simplifies our decision process. Again, what answers do we need and how do we get them? How is the right decision quality information generated fast enough to get inside the decision loop and have an impact? This is not about proving a research finding. It is about getting decision quality information inside the decision loop of a cultivation.
MORE BY MICHAEL R. COLLINS
The analytics domain is a continuum of capabilities, starting with the simplest and progressing sequentially to the more complex and challenging. When the data is aligned with the decision required and the inputs are in hand, the analytics can be, and should be, automated. The following graphic is a proposed continuum that presents the sequence and represents the context, and categories, of analytics. We need to understand where the information need is and apply the right analysis, automation, and integration at the appropriate time. But, to start the process, we need to keep it simple with an understanding of the analytical framework and how to use it.

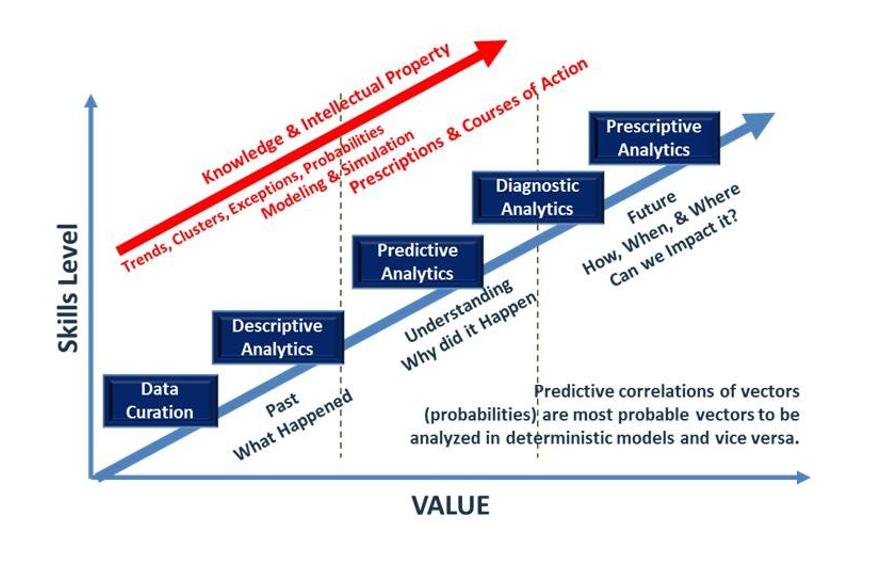
There is no doubt that data often SHOUTS at us, even screams, with decision quality information, but data demands that we understand it, compare it, and analyze it. The continuum starts with curation of the data. This is when we begin to understand it. Curative analytics is first about how to organize the data and retrieve it. This is where it begins to tell its story — it is a story that begins to tell us where the data is in relation to the decision cycle and what happened, or is happening.
We can start listening at this very early stage. Curation is the step that normalizes, manages, maintains, and validates the data. This is done in a post-sensing, post-collection environment, and it is done as a background task. Curation should be automated. The user should not be forced to do this step. Curation puts the data in a standard form and makes it simpler and easier to compare and analyze.
For example, most imagery is both ortho- and geo-rectified before it is presented. This means that the data is adjusted for off-nadir sensing as well as geo-located to provide precise location. This ensures that all data will align to the same geo-reference and enable comparison. The user should not have to worry about any of this.
Once the data is curated and we are beginning to hear its story, the cultivation’s digital twin can begin to describe it by applying basic statistics to the sensed data and calculate the data clusters and their location. It can develop simple contours of common results, iso-lines, and it can establish basic statistics for each data set. It can provide information results that describe the change in the cultivation; it can tell us what it is related to, and why. Again, the user should not have to do anything except ask for this information.
Basic statistics goes beyond curation to describe and provide a context for the data. It lays the foundation for determining the probabilities of what might happen, where decisions might have maximum impact, or what the optimization of a set of actions might cause. In the continuum, each analytics domain builds upon the previous domain and can be implemented sequentially to provide decision quality information inside the decision loop of the cultivation. Each analytics domain adds data sets, time to complete, and complexity, but if we start simple and build upon each prior analytics result the system can provide better and better understanding of the decision information.
In my earlier article, I mentioned there are some items about the soil that are not really changing. These are invariant. The descriptive items for soil might include topography, soil types and horizons, and even historical memory about previous identified stresses like weeds, insects, and fungi. These can all be geo-located and mapped. This information is part of the descriptive continuum, and the collection and analytics for these invariant inputs can be sequenced and automated.
For example, with today’s GPS-guided tractors and planters, there is a real-world precision that a digital farming system can use to generate yield estimates by simple addition and multiplication. We know how much seed we planted; and where. Further, if the type of soil, the soil horizons, and the other soil properties are known, the system can weigh the yield of each seed based upon the potential increase or decrease over the average based upon the description of the soil asset.
Since planting is being done with the precision of GPS and equipment that can literally seed to a given prescription, the digital twin knows exactly what the range of yields will be. There is no ambiguity in these numbers, and it will be the same every time. There won’t be more yield produced then the amount of seed planted. It is the starting point. This is not an algorithm nor is it anything super sophisticated. It is counting and basic descriptive input. A digital farming platform can do this almost immediately.
All of this data holds the insights and predictive power we seek to apply for decision quality information. As humans we cannot handle this much information, we need to use the digital twin and enable it to determine where we need to put our attention. After we get past the scale and describe the data, the digital twin will use this information to see what happened and use that to predict what will happen next. It is about helping us focus our attention; about determining probabilities of occurrences and where it might be happening. This step is about ‘what might happen’ using the probabilities in past data; stochastic processes. This step is non-trivial because of the scale of the task, but it is straight forward, can be sequenced and automated, and is simple to execute.
Beyond predictive processes are the diagnostic processes; instead of stochastic projections, we seek deterministic answers. Predictive projections enable us to understand what happened and use that to predict what might happen in the future, but diagnostic analytics is useful in understanding why things happened. If we know why things happened we can begin to build prescriptions.
Prescriptive analytics is the last stage of analytics, and it builds upon and integrates the cumulative results of the previous predictive and diagnostic analytics processes. The variables and outcomes of these analytics can be measured. These variables can be controlled, monitored, and used to re-calibrate the processes of the digital twin based upon the measured outcomes. The entire process can be continuously monitored and the results fed back into the models and algorithms.
These analytics processes, their levels of implementation, their history, and their progression tell a story; it even shouts this story. These processes start simple and build knowledge and intellectual property as they reveal the form of the agricultural processes in even greater fidelity. These analytics processes, even at their simplest, reveal decision quality information, and provide insights to the prescriptions required to achieve future levels of performance. Their results form a simple sequential framework we can use to understand, analyze, and manage the cultivation.
Subscribe Today For