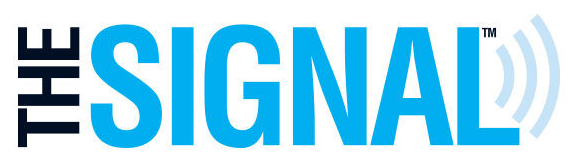


Precision Ag Technology Making a Difference in Brazil

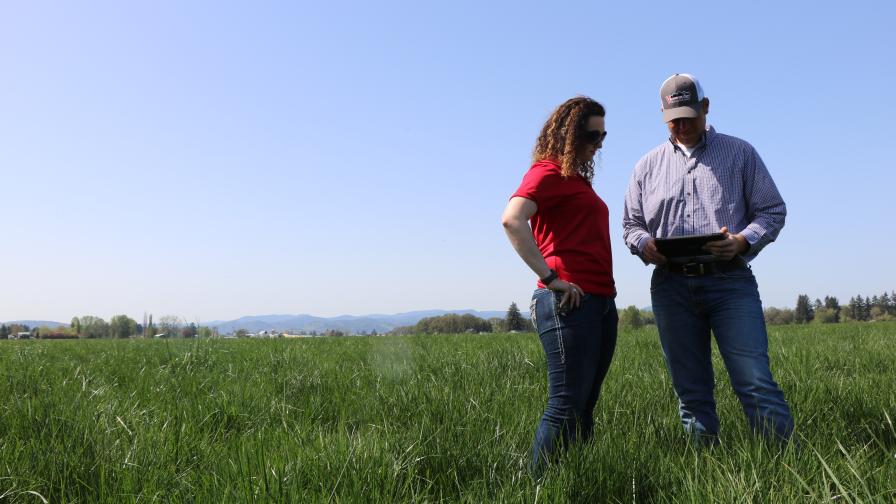
Large flat areas cultivated with soybean, corn and cotton in Mato Grosso, Midwest Brazil.
Editor’s note: Rodrigo Trevisan is Coordinator of Precision Agriculture at Terra Santa Agro in Brazil, where he is responsible for the development of projects related to precision ag on more than 180,000 hectares cultivated with soybean, corn and cotton. In the article below, Rodrigo shares some of his career highlights and provides an overview of how precision agriculture technology is being used by his company, as well as some of the challenges they are facing. In future articles, he will provide more details of the adoption of each of the technologies mentioned.
As a son of farmers who came to Mato Grosso in 1998, I have always been involved in agriculture. During my undergraduate course in Agronomy, held at the Federal University of Mato Grosso in Sinop, I was able to combine my ease of learning mathematics and the passion for soil science, starting to work with geostatistics and spatial variability of soil attributes and crop yield.
The subject aroused my interest so much that I decided to pursue a master’s degree in the area, attending the University of São Paulo-ESALQ. I worked extensively with precision agriculture and was advised by Professor José Paulo Molin, who is one of the leading experts in the subject in Brazil. Although the university was in Piracicaba – SP, I maintained my contact with Midwest Brazil by conducting cotton experiments in the Goáis and Mato Grosso states. The focus of the experiments was the calibration and validation of an algorithm for application of nitrogen fertilizers in cotton using active crop canopy sensors.
After that, I returned to Mato Grosso two years ago to work as precision agriculture coordinator for Terra Santa Agro S/A (www.terrasantaagro.com), which cultivates about 185,000 hectares (460,000 acres) with soybean, corn and cotton. At that time, precision agriculture was beginning to be developed in the company by contracting outsourced services for soil fertility mapping and applying lime in variable rates in a small percentage of the area.
MORE BY RODRIGO TREVISAN
Highlights from the 14th International Conference on Precision Agriculture

From then on a project was defined to adopt new technologies and expand the use of precision agriculture tools, with the objective of reaching 100% of the cropland by 2020. The first stage of the project consisted of a survey of the history of the areas, focused on identification of the level of spatial variability to define the most appropriate tools to be adopted. This process was carried out mainly with the help of satellite imagery and knowledge of the areas by experienced professionals. This historical series of images, covering the period from 1984 to 2015, was also the basis for the delineation of management zones, mainly used for soil sampling.
Besides the use of satellite imagery, the characterization of the spatial variability of the fields also uses soil electrical conductivity (TERRAM – Falker) and active crop canopy sensors (N – Sensor – Yara), in addition to soil sampling and georeferenced field scouting.
Soil sampling is carried out in grids on the fields that will receive soil tillage and lime application in the next season, which represents annually around 20% of the area. The number and locations of the samples are defined according to the information available on the spatial variability of the field, usually the final density is 3 to 5 hectares per sample. The other fields are sampled using management zones, which usually range from 30 to 50 hectares.
The data obtained by soil sampling are the basis for the localized application of lime and fertilizers. In some cases, these data are associated with denser data, such as those of soil electrical conductivity for the variable rate seeding prescriptions.
In corn and cotton we also apply variable rate nitrogen fertilizers, based on the spatial variability detected by the N-Sensor or by recent satellite images. In this case we use the images provided by PlanetLabs, mainly the RapidEye and the 4-band PlanetScope scenes.
In cotton we are also applying nematicides to the planting furrow at variable rates. For this we rely on data from a georeferenced pest and disease monitoring system, associated with yield maps and satellite images of previous crops.
One of the major difficulties we have encountered is related to the adoption of yield mapping, especially for soybeans. This is because not all machines are equipped with the required sensors. Even those that are, did not have the required maintenance over time. In addition to the mechanical problems, we have the difficulty of keeping the header width constant and the large number of maneuvers due to the number of machines (usually 10 to 20) simultaneously harvesting the same field. Ensuring the correct calibration and cleaning of all sensors in a hurrying operation is a major challenge.
Another challenge we face is the lack of results and models for generation of the prescriptions of variable rates of nitrogen and seeds. In this case the crop responses depend a lot on the climatic conditions, the date of planting and the genetic materials used. The way we are trying to solve this problem involves the generation of data for our conditions, through on-farm trials and the repetition of treatments in each management zone in the field. These experiments also make it possible to estimate the profitability that can be obtained with the use of different precision agriculture tools at different levels of field variability, serving as a guide for the direction of new investments.
In future articles I will present some examples and better explain the details of the adoption of each of the technologies mentioned above.
Subscribe Today For